
Visual marketing sits at the center of modern brand communication. Screens shape first impressions, guide decisions, and often decide whether a message gets a second glance or disappears into a fast-moving feed.
In 2025, internet use reaches billions of people worldwide, while social platforms operate at what many researchers call supermajority scale. Most brands compete inside mobile feeds, short video loops, landing pages, and scanning-heavy websites where attention moves fast and patience stays thin.
Visual marketing works through two layers that stay in constant motion. Design systems provide the repeatable rules that hold a brand together. Campaign assets deliver specific messages, offers, launches, and seasonal pushes.
Both layers matter because people scan online content instead of reading line by line. Eye tracking research shows that attention clusters near the top and left side of pages, which changes how headings, images, and calls to action need to appear.
The sections below map out the major types of visual marketing that shape real operations today. Each category focuses on what it does best, where it appears, and how teams keep performance on track.
The Building Blocks Behind Visual Marketing

Before listing formats, it helps to look at the parts that sit underneath nearly every asset.
Brand Identity and Design Systems
Brand identity functions as a visual rulebook. It covers logo usage, color palettes, typography, spacing, imagery style, iconography, and motion rules.
A reliable system prevents drift across teams and stops every new project from turning into a one-off design debate.
Adobe guidance highlights the value of documented brand kits that lock down logo, color, and font usage so production stays consistent across materials.
Common outputs within brand identity work include:
- Logo suites that include full, simplified, icon mark, monochrome, and small-size variants
- Color palettes that define primary, secondary, neutral, and accessibility-safe combinations
- Type systems for headlines, body text, interface elements, and fallback fonts
- Image direction that guides photography style, lighting, and composition
- Iconography and illustration libraries
- Motion rules that define how elements enter, exit, and animate
Operational details matter as much as aesthetics. Adobe also recommends defining font roles, keeping color palettes complete, including white and black, and locking critical elements so visual consistency survives scale
Content Design and Readability Patterns
Design systems still need to survive real user behavior. Web visitors skim, scroll, and filter information in seconds.
Research from Nielsen Norman Group shows that visuals need to carry real information or intent. Decorative filler rarely earns attention and often gets skipped.
Major Types of Visual Marketing
Major types of visual marketing cover the visual formats brands use to present ideas, shape perception, and move people toward action across digital and physical spaces.
1. Social Media Creative
Social media creative produces the highest asset volume for many brands. It covers several distinct formats that serve different storytelling needs.
Common Formats
- Static posts with single images
- Carousel posts for multi-panel storytelling
- Stories and Reels in vertical, full-screen format
- Thumbnails for YouTube, Shorts, and creator partnerships
- UGC-style assets with phone-shot visuals and captions baked into the image
Scale drives social importance. DataReportal reports social platform user identities in the billions, with continued growth year over year, which places heavy pressure on creative clarity.
Design Checks That Protect Performance
- Type stays legible at arm’s length on phones
- One primary message appears per frame
- Safe margins protect content from UI overlays
- Brand markers remain present without overwhelming the composition
Metrics That Match Format
- Saves, shares, and completion rate often matter more than clicks in short-form placements
- Carousel drop-off per panel highlights weak storytelling points, often inside the first two panels
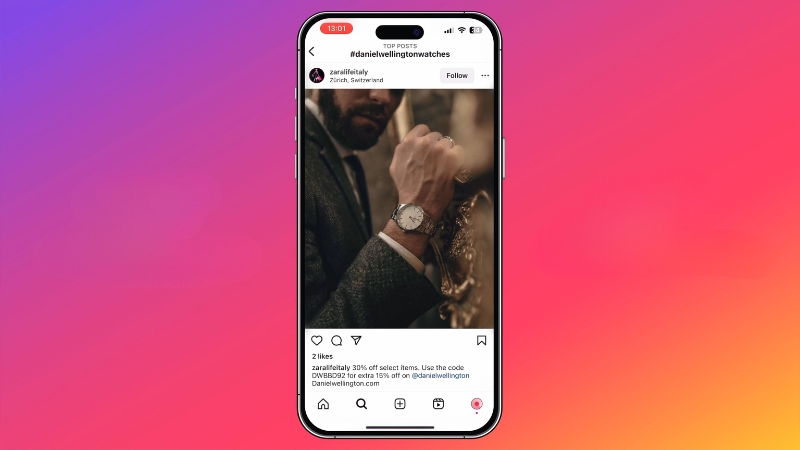
2. Short-Form Vertical Video and Motion Graphics
View this post on Instagram
Short-form vertical video now operates as its own category. Google reporting shows cross-platform audience behavior, including a stat that 40% of YouTube Shorts users do not use TikTok or Instagram Reels at all. Growth signals also show rising view volumes and increasing TV viewing for Shorts over time.
Where Short-Form Performs Well
- Product discovery and first-impression positioning
- Demonstrations in 6 to 15 seconds
- Social proof through creator reactions and testimonials
Motion Design Contributions
- Timed reveals create hierarchy across time
- Pattern changes every few seconds support retention
- On-screen captions maintain clarity without sound
3. Long-Form Video and Episodic Series Visuals
Long-form video supports structured explanation and brand trust. Visual marketing in this category includes:
- Intro sequences and branded bumpers
- Lower-third captions and labels
- Supporting B-roll and close-ups
- Slide-style overlays for data and procedural steps
Reuters reporting based on Ofcom data shows adults in the UK watched YouTube for an average of 51 minutes per day in 2025.
Usage also reached 94% of adult internet users in May 2025, which confirms the continued influence of long-form video environments.
4. Display Ads and Standard Digital Ad Units
Display advertising remains central to retargeting, awareness, and publisher placements. Industry standard sizes define formats more than stylistic trends.
Common IAB units include:
- Medium Rectangle 300×250
- Leaderboard 728×90
- Billboard 970×250
- Smartphone Banner 300×50 or 320×50
Design Rules That Improve Banner Results
- High contrast and one focal point
- One promise and one action
- Type-sized for compression and responsive scaling
- Clear first frames for slow-loading environments
5. Paid Social Ads
Paid social overlaps with organic content, though design constraints differ.
Key production factors include:
- Strong first frames that capture attention before scrolling
- Text placement planned around platform overlays
- Placement-specific exports guided by internal previews and overlay tools
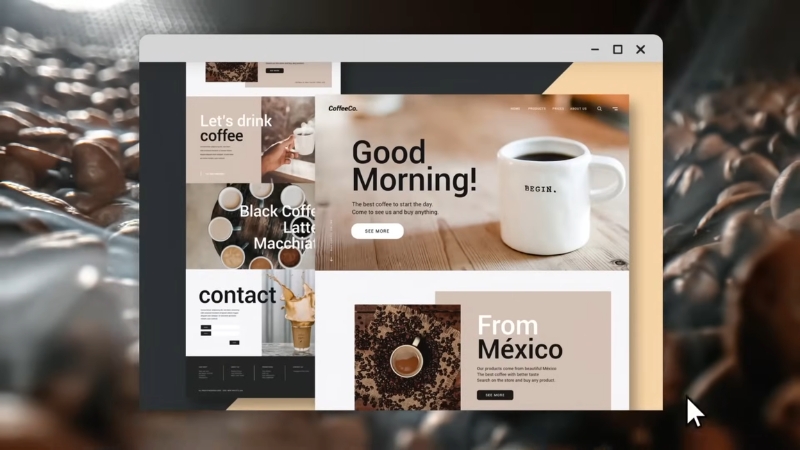
6. Website Visuals and Landing Page Design
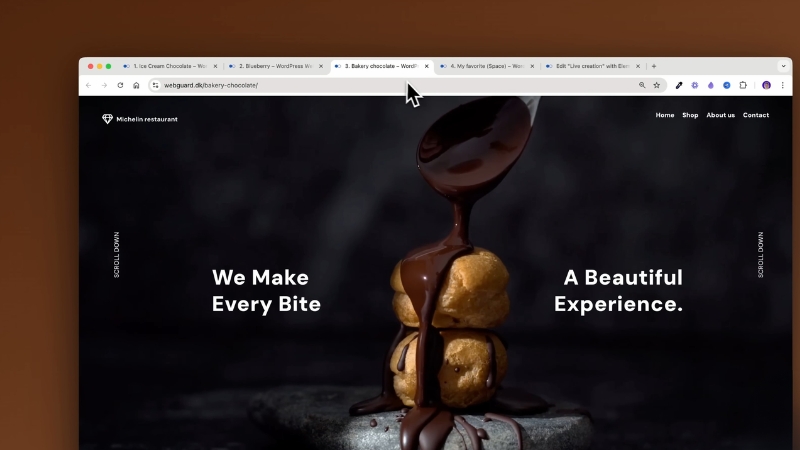
Website and landing page design sit between marketing and product. Visual marketing includes:
- Hero sections with headlines, support copy, calls to action, and imagery
- Product screenshots with annotations
- Comparison tables and testimonial blocks
- Illustration systems for abstract concepts
Web behavior stays scan-heavy. Nielsen Norman Group research we mentioned earlier supports visuals that clarify content rather than decorate it, which shapes layout planning and asset selection.
7. Email Design and Lifecycle Creative
Email visual design works under tight constraints such as dark mode, client rendering differences, image blocking, and small screens.
Common Formats
- Header and hero images
- Product grids
- Lightweight animated GIFs
- Promotional badges such as limited-time offers and free shipping
Operationally, email benefits from modular systems rather than bespoke designs for every send.
8. Infographics and Data Visualization
@neilpatelCompanies are throwing money at people who can do this 1 simple thing with their data. 65% of people are visual learners, and companies need eye-catching infographics to drive traffic and backlinks. Use ChatGPT to find insights from their data, then turn those insights into beautiful visuals with Canva. It’s simple, effective, and highly in demand.
Infographics function as compressed argument structures. Visual hierarchy, annotation, and truthful scaling carry more importance than decoration.
- Data visualization focuses on accuracy and insight
- Infographics blend charts, icons, and narrative labels to guide interpretation
Structured educational resources on visualization emphasize context and annotation while warning against misleading chart decoration.
9. Presentations, Pitch Decks, and Sales Collateral
Presentations remain central to B2B sales, partnerships, and fundraising.
Visual marketing includes:
- Slide templates for titles, sections, data, and case studies
- Diagram libraries for workflows and funnels
- Proof assets such as logos and metrics
One slide communicates one idea, supported by a visual that proves it.
10. Print Design, Ooh, and Environmental Design
Print and environmental visuals maintain brand presence in physical space.
Types
- Posters and flyers
- Brochures and one-pagers
- Event signage and wayfinding
- Trade show booth graphics
Design considerations differ from digital due to viewing distance, printing color variation, and physical-to-digital bridges through QR codes and short URLs.
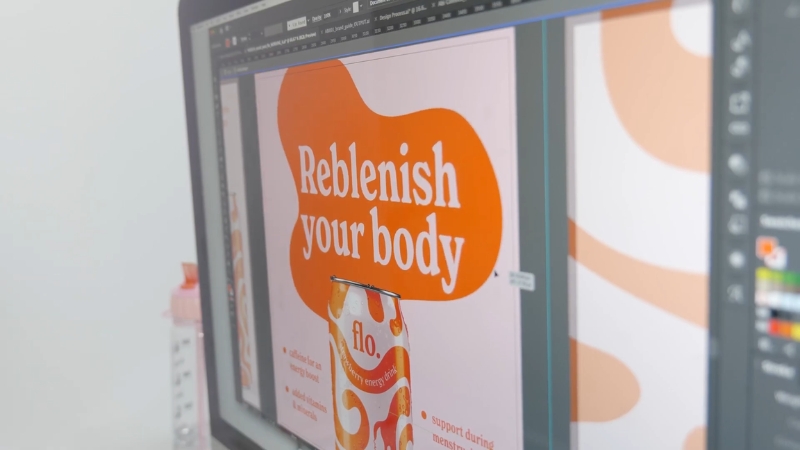
11. Packaging and Retail Shelf Visuals

Packaging competes inside dense retail environments.
Design priorities include:
- Category recognition
- Differentiation at distance
- Compliance and readability
- Photography and iconography aligned with the product promise
Packaging often becomes the most persistent brand touchpoint consumers see.
12. Interactive Content, AR, and Immersive Visuals
Interactive formats merge visual marketing with product experience.
Examples
- Quizzes and configurators
- Pricing and savings calculators
- Scroll-driven storytelling
- AR try-ons and filters
Production discipline matters here due to load speed, device compatibility, and accessibility requirements.
Production Planning Comparison
| Visual type | Primary job | Best for | Typical production load | Metrics that matter |
| Brand identity system | Recognition and consistency | Multi-channel operations | Medium upfront, low per asset | Brand audits, recall studies |
| Static social | Fast message delivery | Promotions, announcements | Low | Saves, shares, CTR |
| Carousel social | Step-by-step persuasion | Education, comparisons | Medium | Panel drop-off saves |
| Short-form vertical video | Retention and discovery | Product discovery | Medium to high | Completion rate |
| Long-form video | Trust and depth | Tutorials | High | Watch time |
| Display banners | Reach and retargeting | Publisher buys | Low to medium | Viewability |
| Landing page visuals | Conversion support | Paid traffic | Medium | Conversion rate |
| Email creative | Repeatable revenue | Lifecycle marketing | Low to medium | Revenue per send |
| Infographics | Compressed explanation | Reports, PR | Medium | Time on asset |
| Sales decks | Stakeholder persuasion | B2B sales | Medium | Progression rate |
| Print and OOH | Presence at a distance | Local branding | Medium | QR scans |
| Packaging | Shelf conversion | Retail and DTC | High upfront | Sell-through |
Design Constraints That Apply Across Formats
Every visual asset carries shared rules that shape how it reads, loads, and performs. Format changes, yet accessibility, contrast, and clarity remain non-negotiable across channels.
Accessibility and Contrast
Text contrast affects performance and legal compliance. WCAG guidance sets contrast expectations at 4.5:1 for normal text and 3:1 for large text, with higher thresholds for enhanced compliance.
Material Design documentation aligns contrast and legibility with WCAG targets, which supports shared UI and marketing systems.
Decorative Visuals Rarely Earn Attention
Eye tracking research shows that users focus on images that provide relevant information and skip decorative filler.
Real environments, real staff, and real product use often perform better than generic stock imagery. Every image benefits from a defined job, such as showing scale, steps, or outcomes.
Creative Quality Shapes Profit
WARC and Kantar reporting ties creative quality to profitability, with findings showing that high-quality creative drives substantially more profit than low-quality creative.
In practice, quality reflects message clarity, consistent brand cues, pacing, and alignment between claims and landing pages.
A Scalable Production Workflow
A scalable production workflow keeps creative output consistent, measurable, and repeatable across channels without slowing teams down or diluting brand structure.
Start With Systems and Templates
Locked templates reduce chaos and speed production. Useful sets include:
- Social post layouts
- Story and Reel templates
- Email module systems
- Presentation slide systems
Adobe guidance on brand kits supports locking color and font roles to maintain consistency across asset families.
Treat Formats as Families
Grouping production by format families such as feed static, vertical video, landing pages, and email modules reduces tool switching and speeds testing cycles.
Build Measurement Into File Naming
For paid and lifecycle creative, filenames benefit from versioning that tracks:
- Message angle
- Visual approach
- Hook or headline variant
- Placement variant
Testing one variable at a time protects learning quality.
Closing Thoughts
Visual marketing shapes how brands appear, how offers land, and how trust builds. Clear systems, disciplined formats, accessible design, and consistent measurement keep visual work aligned with business goals.
Strategic use of nostalgia in visual marketing campaigns can also strengthen emotional recall and deepen audience connection when applied with intent and restraint.
Teams that treat visual marketing as structured production rather than decorative output create assets that perform across feeds, screens, shelves, and physical spaces.